What Makes an NBA Shooter Elite?
We often hear certain players get labeled as elite shooters — but what does that actually mean? Is it their ability to put up high-scoring games? Or their ability to score consistently while being efficient? Maybe it’s the types of shots they put up - wide-open catch-and-shoot looks versus step-back threes with a hand in their face. As fans of the game, we celebrate the KDs, the Stephs, the Klays of the league; however, what really separates them from your average NBA shooter? Is it something we can actually measure, or is there more to it than the numbers can tell us?
Which leads me to explore the following question:
Are prolific scorers like Kevin Durant, Stephen Curry, and Klay Thompson elite shooters because they get great looks, or because they consistently make tough shots and outperform shot quality metrics?
To get closer to an answer, I’m going to examine mostly per-game shooting metrics from this past season (2024–25), but also per-game shooting metrics from previous seasons for a range of players we typically label as elite, average, or below-average shooters. I’ve already selected Kevin Durant, Stephen Curry, and Klay Thompson as the elite tier. Tobias Harris and Jordan Poole represent middle-of-the-pack scorers, while Josh Giddey and Kyle Kuzma are often considered as players with poor shooting abilities.
I will be analyzing the following per-game metrics:
- Proportion of unassisted points (%UAST_Pts) – how often players score off of shots they created themselves.
- True Shooting Percentage (TS%) – a scoring efficiency measure that accounts for free throws.
- Effective Field Goal Percentage (eFG%) – similar to regular FG%, but gives more weight to three-pointers.
- Shot Quality – this one’s a bit more complex, but arguably the most important.
What is Shot Quality?
In essence, Shot Quality is a measure of how good a shot was. It provides an estimate of the likelihood of a shot going in, based on a range of contextual and environmental conditions. Factors such as the distance of the shot, the proximity of the defender, and the amount of time remaining on the shot clock, among others. It’s easier to look at shot quality as a representation of the expected eFG%. It’s important to note that shot quality does not consider the outcome of the shot but focuses purely on the process. By analyzing shot quality and viewing it as a player’s expected eFG%, we can compare it with a player’s actual eFG% to determine whether or not they are outperforming the quality of looks they get. Essentially, we can determine if a player is efficiently converting their opportunities and making tough shots or simply benefiting from great looks. To better understand what shot quality captures and ignores, I’ve broken it down below.
Factors that Contribute to Shot Quality:
- Shot Distance – Closer shots tend to be higher quality.
- Shot Angle / Location – Straightaway vs. corner; paint vs. perimeter.
- Shot Type – Layups, dunks, floaters, catch-and-shoot threes, etc.
- Defender Proximity – Tightly contested shots are of lower quality.
- Time on Shot Clock – Rushed, late-clock attempts are lower quality.
- Time Context – Time since possession started, time remaining, and period.
- Score Differential – Game situation can impact shot value.
- Assisted vs. Unassisted – Assisted shots often lead to more open looks.
- Possession Type – e.g., transition, offensive rebound, turnover, etc.
- Shot Context – Whether it was a putback or a secondary opportunity.
- Game Type – Regular season vs. playoffs.
What’s NOT Taken Into Account:
- Shooter identity or reputation – Shot Quality is blind to who takes the shot.
- Whether the shot went in – Only the shot’s characteristics matter, not the outcome.
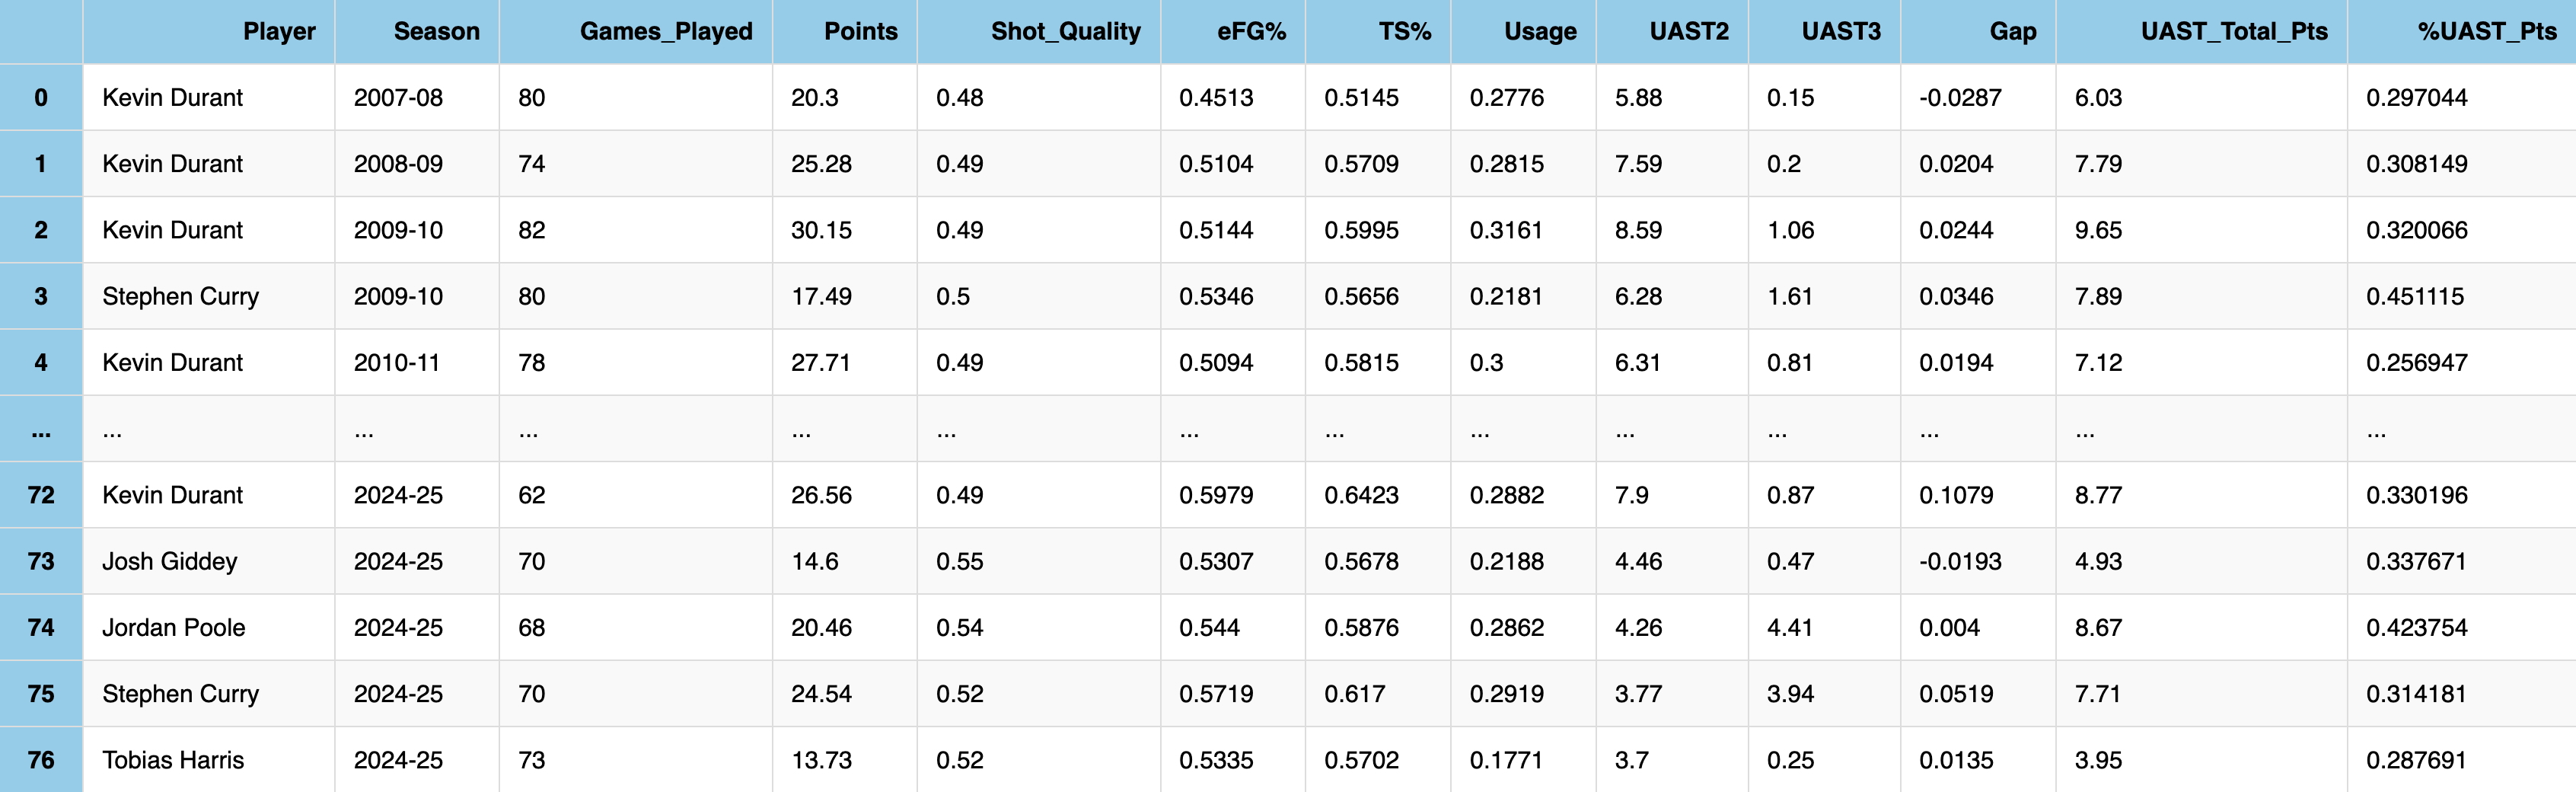
Cleaned Dataframe: Advanced Shooting Metrics per Game by Season for Selected Players
Now that I have introduced the advanced shooting metrics and defined the Shot Quality metric, I prepared my data for analysis by creating a dataframe. I collected the data from pbp_stats and cleaned it to include only the stats I needed. Each row represents a player in a given season, while the columns hold per-game stats that can be used to better understand a player’s scoring abilities:
- Player – the name of the player.
- Season – the NBA season the stats correspond to.
- Games_Played – number of games played that season.
- Points – average points scored per game.
- Shot_Quality – expected eFG% based on the context of each shot.
- eFG% – effective field goal percentage, accounting for the added value of three-pointers.
- TS% – true shooting percentage, including free throws for a more complete measure of scoring efficiency.
- Usage – proportion of team plays used by the player while on the floor.
- UAST2 – unassisted two-point shots per game.
- UAST3 – unassisted three-point shots per game.
- Gap – the difference between actual eFG% and expected eFG% (Shot_Quality).
- UAST_Total_Pts – total points scored unassisted per game.
- %UAST_Pts – proportion of a player’s points per game that are unassisted.
A preview of the cleaned dataframe is shown below, giving a snapshot of the players and stats included in the analysis.
2024-25 Season: Shot Quality vs Actual eFG% and Gap for Selected Players
To begin exploring how these metrics play out in practice, I first focused on the most recent season (2024-2025), creating visualizations to compare the selected players’ expected shooting outcomes with their actual shooting performance. The first visualization I made was a bar graph with the players on the x-axis and eFG% on the y-axis. For each player, there are three bars: one representing their expected eFG% (Shot Quality), one displaying their actual eFG%, and the last one illustrating the gap between the two. This layout allows us to see which players are outperforming their shot quality (positive gap) or underperforming it (negative gap).
By examining the bar graph above, it is evident that only Kevin Durant and Stephen Curry significantly exceeded their expected shooting metrics, with all other players slightly overperforming their shot quality or falling short of their predicted shot outcomes. Interestingly, Klay Thompson, whom I initially categorized as an elite shooter, displays only a tiny positive gap in comparison to the elite tier players. This indicates that Klay Thompson’s actual eFG% barely surpasses what his shot quality would predict. His gap also ended up being even smaller than Tobias Harris’, suggesting that, despite his reputation as an elite shooter, Thompson’s scoring in this past season wasn’t very reliant on his ability to consistently make shots above expectation. Thus, he should fall into the average shooter category with Tobias Harris and Jordan Poole. Of course, this may not reflect Klay Thompson’s career-long shooting ability, as this small gap is specific to his performance in the 2024-2025 season. So to get a clearer picture, I’ll later examine the same metrics for Klay over the last five seasons.
As expected, Josh Giddey and Kyle Kuzma clearly fall into the below-average shooting tier as they consistently underperform their shot quality. Their evident negative gaps portray that they struggle to convert favorable opportunities, whereas an elite shooter would capitalize on them. To further explore these trends, I created a scatter plot using the same x-axis and y-axis as the bar graph. The following scatter plot again compares each player’s expected Shot Quality against their actual eFG%. Additionally, the scatter plot includes a diagonal y=x reference line, which provides a visual benchmark for perfectly efficient shooting. It’s good to note that points toward the left of the plot represent players who typically take tougher shots, while points to the right represent those with easier opportunities on average. This allows us to see not only how well players perform relative to expectation, but also the average difficulty of the shots they attempted in the 2024-2025 season.
Looking at the scatter plot, not only do Kevin Durant and Stephen Curry display the largest positive gaps between their point and the y=x reference line, indicating that they consistently exceed their expected shooting metrics, but they also are the players farthest to the left on the plot. Meaning that Durant and Curry take the toughest shots while also shooting with the most accuracy among the selected players. This combination of high shot difficulty and consistent overperformance reinforces their status as elite shooters. The visualization supports the notion that Kevin Durant and Stephen Curry have the ability to efficiently knock down challenging opportunities at a rate well above what is expected.
Interestingly enough, Josh Giddey and Kyle Kuzma are the players farthest to the right on the plot, meaning they have the best looks yet still underperform relative to their shot quality. These metrics highlight why they represent players with below-average shooting efficiencies. Ultimately, these visualizations clearly separate elite shooters from average and below-average shooters, emphasizing that shot quality compared with effective field goal percentage successfully captures true shooting skill.
Klay Thompson: Shot Quality vs Actual eFG% and Gap Over the Last 5 Seasons Played
Revisiting Klay Thompson’s shooting performance, I created a bar graph similar to the previous one above, but focusing exclusively on Klay Thompson over the last 5 seasons he played. Each cluster of bars represents a season, and the three bars in the cluster again represent expected eFG% (Shot Quality), actual eFG%, and the gap between the two. This visualization allows us to determine whether the small positive gap previously observed in the 2024-2025 season is an outlier, meaning he had a sudden decrease in shooting performance, or part of a consistent pattern in his shooting performance over time.
Examining the graph, it becomes clear that the 2024-2025 season is indeed an outlier in Klay Thompson’s shooting performance throughout his career. The large positive gap between his actual eFG% and expected eFG% illustrates an evident sudden decline in his ability to outperform the expected shooting outcomes of his shots in his most recent year. The visualization indicates that Klay used to regularly exceed shooting expectations and previously performed like an elite shooter. Overall, this contrast highlights that the small gap in the most recent season does not reflect his typical shooting ability, possibly suggesting that he is past his prime.
2024-25 Season: Self-Created Shots vs TS% for Selected Players
While the previous visualizations highlight how Kevin Durant and Stephen Curry outperform their expected shooting metrics, it’s worth considering whether their high efficiency is a result of consistently getting open looks rather than creating their own shots. After all, a player who primarily relies on wide-open catch-and-shoot opportunities will look efficient on the stat sheet; however, they may not truly be an elite shooter. It can be argued that elite shooters possess the skill to generate scoring chances on their own and are able to efficiently convert such difficult self-created shots. Thus, to better understand if the shooters I categorized as elite are benefiting from assisted looks or relying on their own ability to create opportunities, I examined each selected player’s rate of unassisted scoring in relation to their overall scoring efficiency.
To explore this idea, I created a scatterplot with each player’s self-created scoring rate (% of unassisted points) on the x-axis and True Shooting Percentage (TS%) on the y-axis. I also included a regression line to show the general relationship between creating your own shots and overall scoring efficiency. It’s good to note that points toward the left represent players who rely heavily on assists to score, while points on the right indicate players who generate the largest proportion of their points individually. This layout provides insight into not only how efficiently players score, but also an idea of how much of their scoring comes from creating their own opportunities versus being given great looks from their teammates.
The distribution of points shows that Kevin Durant and Stephen Curry again prove to be elite shooters as they stand out as the two points toward the top right. This positioning indicates that they are not only highly efficient scorers in terms of true shooting (TS%), but they also generate a significant portion of their points on their own. Their ability to create and convert difficult shots reinforces the idea that they belong in the elite tier of shooters, capable of efficiently and skillfully scoring, without relying heavily on teammates for opportunities.
Conversely, Klay Thompson’s point is a clear outlier as it is the point farthest to the left on the plot, indicating that, at least in the 2024-2025 season, Klay strongly relied on assisted looks rather than creating his own shots. Klay’s reliance on opportunities granted to him by his teammates supports the previous observation that, according to the data from the 2024-2025 season, he no longer should be categorized as an elite shooter. Moreover, Klay Thompson’s true shooting (TS%) doesn’t stand out among the selected players categorized as average and below-average, further supporting the notion that he is not an exceptional shooter.
Lastly, an insight that is surprising at first glance is the fact that Jordan Poole is the player farthest to the right on the plot. This shows that in comparison with all of the selected players, he scores the largest proportion of his points by creating his own looks. While this may seem unexpected initially, it aligns with his playstyle, which focuses heavily on isolation and one-on-one possessions to create scoring chances. Ultimately, the scatter plot above effectively differentiates elite shooters like Kevin Durant and Stephen Curry from average and below-average players, emphasizing that the ability to create your own shots and convert them efficiently is essential for a player with true shooting skill.
Kevin Durant vs Kuzma: Shooting Metrics Radar for 2024-25 Season
Now that we have successfully identified Kevin Durant as an elite shooter, I created a final comparison using a radar chart that overlays Kevin Durant’s shooting metrics with Kyle Kuzma’s. The following visualization will highlight the contrast between an elite shooter and a below-average one, illustrating the clear differences in efficiency, shot quality, accuracy, and scoring profile.
As determined earlier, an elite shooter can be defined by their ability to efficiently convert difficult shots while also creating their own. The radar chart provides a clear distinction as Kevin Durant’s metrics extend outward across efficiency and shot creation, while Kyle Kuzma’s profile remains far more constrained. Notably, shot quality is the only metric where Kuzma’s profile extends farther outward than Durant’s, highlighting that Durant consistently takes tougher looks yet still outperforms Kuzma in both efficiency and accuracy. This evident contrast reinforces Durant’s status as an elite shooter.
Answering the Question: What Truly Defines an Elite Shooter?
In summation, while the question of whether an NBA player’s shooting ability can truly be measured is complex, the statistics suggest that it can be quantified. By examining advanced shooting metrics such as shot quality, efficiency, and the proportion of self-created scoring, we can distinguish between players who rely primarily on favorable looks and those who consistently convert difficult shots they generate themselves.
Prolific scorers like Kevin Durant and Stephen Curry exemplify elite shooters because they possess the ability to outperform their expected efficiency despite consistently taking difficult shots, all while creating a significant portion of those opportunities themselves. In contrast, players like Klay Thompson in the 2024-2025 season demonstrate that relying heavily on assisted looks and not exceeding their expected shot quality can limit a player’s classification as an elite shooter. Similarly, below-average shooters such as Kyle Kuzma and Josh Giddey often fail to capitalize on high-quality looks and as a result underperform relative to their expected shot quality. This further reinforces that the ability to consistently convert open looks is essential for being at least an average shooter in the NBA.
Ultimately, this analysis not only defines what makes a shooter elite but also highlights the overlooked aspects of NBA scoring that traditional statistics often don’t cover. It emphasizes that true shooting skill is not just about getting good looks, but about consistently outperforming expected efficiency while finding ways to do so independently. In the future, it would be interesting to expand this analysis by exploring statistical data across all NBA players to further evaluate whether elite scoring truly requires looking beyond open looks.
Shot Difficulty in Motion: Visualize Shooters Outperforming Shot Quality Metrics
To complement this analysis, the video below provides real-world examples of NBA players defying the numbers by knocking down difficult shots.